Ransomware has been the main focus of many blogs, talks and complaints recently. They come in all shapes and sizes. One day last week, I had a chance to look at a variant of Locky. You can find many articles on Locky ransomware. However, the majority of the articles focus on behavior, delivery methods and features. Instead, I am interested in the bits and bytes of the main pay load. I want to know how Locky is designed, how it works, and how it may fail. Hence, this post!
I would like to provide a walkthrough for main reversing process. I try to not have any "magic" decision like "set a break point at 0x12345 and see that it is unpacked". But, I rather you travel with me through the decision making process of why we look at function XYZ and why we break at 0x12345. Feel free to play a long, or, just read for your own entertainment.
0. Pre-Req:
I assume you are
comfortable with reversing and debugging malware. I assume you use a
virtual machine technology of some kind. Please do not infect
yourself. If you are looking for a commodity sample, malwr[11] and virustotal[12] are
both great sources. You also need the following toys to play along:
-
A virtual machine software. There are many choices: VMware [1] and VirtualBox [2] are probably the most common. Pick one that suits your preference.
-
A Microsoft Windows virtual machine. I use Windows 7 x86. XP works as well. I have not tested on Windows 8, 8.1 or 10, but I assume they work just fine.
-
A debugger. I use Microsoft Windbg[3]. OllyDb[4], ImmunityDebugger[5] are two other common options.
-
A disassembler. I use IDA[6]. The freeware version works just fine. If you have another alternative to IDA, please, please, please let me know.
-
PEiD[7] is still a very nice tool for generic PE information. The KANAL plugin is very useful in many cases.
-
CFF explorer[8] is a nice free tool for viewing the PE file info as well.
-
Tools for searching for strings. I use Linux strings command. Make sure you also check strings -el for windows Unicode strings in the sample.
-
Process Hacker[9] is a great tool to monitor a process behavior.
-
Process Monitor[10 from SysInternal suite is also great to record many events happen over time. It does, however, generates a lot of noise, so it’s best to filter out unnecessary operations or processes before running your sample.
1. First look:
The first look
turns out to be great. PEiD reports that the file is not packed. CFF
explorer shows complete import table, as well as plenty of proper
sections. Running strings on the sample reveals many, many strings,
which is always a good sign that the sample is not pack. All these
are great signs, as packed malware is a lot tougher to handle. Let’s
open up in IDA and see what it does.
 |
| PEiD shows that file is not packed. |
 |
| CFF explorer shows full import table |
 |
| And "proper" sections |
IDA shows WinMain
to be pretty simple. However, poking around a little shows that the
sample is either encrypted or packed with an unknown packer. We see
there is no real structure to the code. There are many global
variables and constants being used. All of this make analysis
impossible.
This is one prime
example why we should not trust our tools completely. It is always
best to verify with a disassembler and check the code execution.
2. Unpack
Since this sample
is not packed by a standard packer, we have to unpack it manually.
The most common approach is looking for the end of
decryption/unpacking stub and set a break point there. However,
after many attempts, I have not found a good location for that just
by looking at the assembly code.
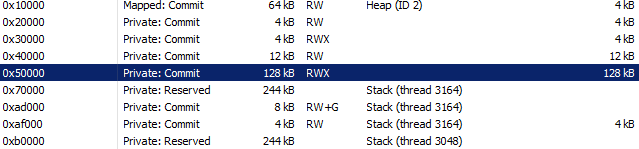 |
| Process Hacker shows a RWX memory region committed. |
Instead, I turn
to the dynamic analysis tools. I let the malware run, and capture its
events. As you can see Process Hacker shows a few memory region with
RWX permission. It is a good indication that such region is allocated
and filled out by the unpacking stub before resuming its execution
there. We also see a new thread created and executing in a different
memory region. Therefore, I try to set a breakpoint at CreateThread
API, hoping to catch its execution. Make sure you have debugging
symbols loaded for windows dll. Using windbg, set your break point
using
bp kernel32!CreateThreadStub
If you use OllyDebugger
or ImmunityDebugger, within the assembly panel, type Ctrl-G, and type
in “CreateThread”. Olly will takes you to CreateThread entry
point. There, you can set a break point using F2.
 |
| A new thread is created at 0x5152 |
 |
| A CreateThread even in Process Monitor. |
Now continue
execution until CreateThread is called. You will be able to see the
address of the new thread.
 |
| WinDbg breakpoint at kernel32!CreateThreadStub |
 |
| And the breakpoint at the ThreadFunction at 0x405152 hits |
Next, we need to
dump the image in memory, and fix up the entry point for it. If you
are using Olly, there is a plugin call OllyDump that can achieve the
task easily. For Windbg, I use Scylla to archive such task. Select
the process, and click “File”->”Dump”. Then, you can fix
the original entry piont OEP and use IAT auto search to search for the import address table (IAT). Click GetImports
to verify all the imports are fixed properly. You can also use ImportREC, which is shown in the screenshot below.
 |
| ImportREC shows all import resolves properly. |
Now that we have successfully unpack Locky, we can look into its real behavior in the next post.
Links:
[1] - https://my.vmware.com/
[2] - https://www.virtualbox.org/wiki/Downloads
[3] - https://msdn.microsoft.com/en-us/windows/hardware/hh852365.aspx
[4] - http://www.ollydbg.de/
[5] - https://www.immunityinc.com/products/debugger/
[6] - https://www.hex-rays.com/products/ida/support/download.shtml
[7] - https://www.aldeid.com/wiki/PEiD
[8] - http://www.ntcore.com/exsuite.php
[9] - http://processhacker.sourceforge.net/
[10] - https://technet.microsoft.com/en-us/sysinternals/processmonitor.aspx
[11] - https://malwr.com/
[12] - https://www.virustotal.com/
No comments:
Post a Comment